
Overview
The Attendance Dashboard provides snapshots of student attendance information compiled into two Attendance Trend graphs. The graphs are only displayed for schools with Attendance Enrollment data, including schools using Flex Scheduling (positive or negative attendance).
For traditional attendance schools, data is populated from the Attendance Data (ATT) table. For Flex Attendance schools, data is populated from the Class Attendance (CAT) table. In Daily schools or negative attendance schools, the counts are based on the All Day Code in ATT.AL. In Flex period schools where positive attendance is used, the counts will be based on the periods instead from the CAT table.
For Texas schools, the counts exclude students who do not generate ADA funding (ADA Eligibility Codes 0 or 9).
NOTE: Currently, the Attendance Dashboard does not support using period-based counts for traditional (non-flex) positive attendance schools. It relies on the All Day Code, which can lead to inaccurate data for Present and/or Absences. A future update is planned to allow the dashboard to use period-based counts instead of the All Day Code.
Security ↑
Table | Permission | Description |
|---|---|---|
| Absence Codes (ABS) | Read | View Absence Code information |
| Attendance Data (ATT) | Read | View Attendance information for traditional schools and flex daily schools |
| Class Attendance (CAT) | Read | View Attendance information for flex period attendance schools |
Filters and Options ↑
The Filters and Options tab is collapsed by default. This section allows users to specify the Date Range filter. Limiting the date range is recommended. If modifying the date range, click Generate Dashboards to update the graph.
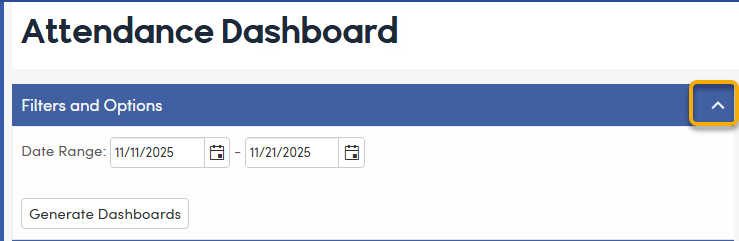
The updated information is displayed in the Results - Attendance Trend tab.
Results - Attendance Trend ↑
The Results - Attendance Trend section includes two graphs, followed by a data table.
Upper Graph
The upper graph displays total membership and total number of students marked Present by date according to the Attendance All Day code (ATT.AL) for negative attendance schools including a breakdown by gender. For Flex positive attendance schools, the Present counts will be determined by the period totals.
- X Axis (horizontal) - Dates within the specified Date Range are listed.
- Y Axis (vertical) - Labels for total attendance enrollment counts are listed.
- Legend
- Total Enrollment (California only) - The count of all students with an attendance enrollment record for the particular date.
- Total Membership (Texas only) - The count of all students with an attendance enrollment record for the particular date, excluding students with ADA Eligibility Codes 0 or 9 (i.e., students not generating attendance for funding purposes).
- Gender - Total Enrollment/Membership counts, color coded by gender. For Texas schools, students with ADA Eligibility Codes 0 or 9 (i.e., students not generating attendance for funding purposes) are excluded.
- Present - Total count of students marked Present by date according to the Attendance All Day code (ATT.AL) in all daily attendance schools or any negative attendance school. Flex Positive period attendance will count Present codes based on the Periods in CAT table.
Texas:

California:

Lower Graph & Data Table
The second graph displays a detailed breakdown of attendance data, showing the number of absences, period tardies, excused absences, and unexcused absences. These categories are based on the Attendance Types configured on the Update Absence Codes page (ABS.TY).
- X Axis (horizontal) - Dates within the specified Date Range are listed.
- Y Axis (vertical) - Labels for the number of students are listed.
- Legend (ABS.TY)
- Absent (ABS.TY = 1-Unverified Absence, 2-Excused Absence or 3-Unexcused Absence)
- Pd Tardies (ABS.TY = 5-Tardy to Class, 8-Excused Tardy or 9-Unexcused Tardy)
- Excused Abs (ABS.TY = 2-Excused Absence)
- Unexcused Abs (ABS.TY = 3-Unexcused Absence)
The Data Table below the graph provides the same information as the graph but in table format. Additionally, the Present and % Present are including in the Data Table.
- Total Enrollment (California only) - The count of all students with an attendance enrollment record for the particular date.
- Total Membership (Texas only) - The count of all students with an attendance enrollment record for the particular date, excluding students with ADA Eligibility Codes 0 or 9 (i.e., students not generating attendance for funding purposes).
- Gender columns - breakdown of Gender for students with Attendance Enrollment.
- Present
- Daily School and any period school where negative attendance is used - The Present and Absence counts will be based on the All Day code in ATT.AL.
- Positive Attendance Flex Schools - The Present and Absence counts will be based on the period codes using CAT.AC. If a student has any Present code, the student will be considered present even if there are absences in other periods.
- % Present - The Total number of Present for the day divided by the Total Enrollment
- Absent - The Absences will include any unverified, excused or unexcused absence. For positive attendance schools, the student's absence will be counted as 1 if the student has no Present code for any part of the day.
- Pd Tardies - All tardies will be counted throughout the day. Periods are counted individually and can exceed more than 1 per day.
- Excused Abs - Number of excused absences (ABS.TY = 2) from the Absent column.
- Unexcused Abs - Number of unexcused absences (ABS.TY = 3) from the Absent column.
NOTE: The Excused Absences and Unexcused Absences columns will not always sum up to the Absent column. This is due to the Absent column including Unverified Absences.

- On either graph, hover over a point on the graph to view specific information.

- To hide a line on either graph, click the corresponding label in the legend. When a line is hidden, the legend label is grey.

To show the line, click the legend label again.
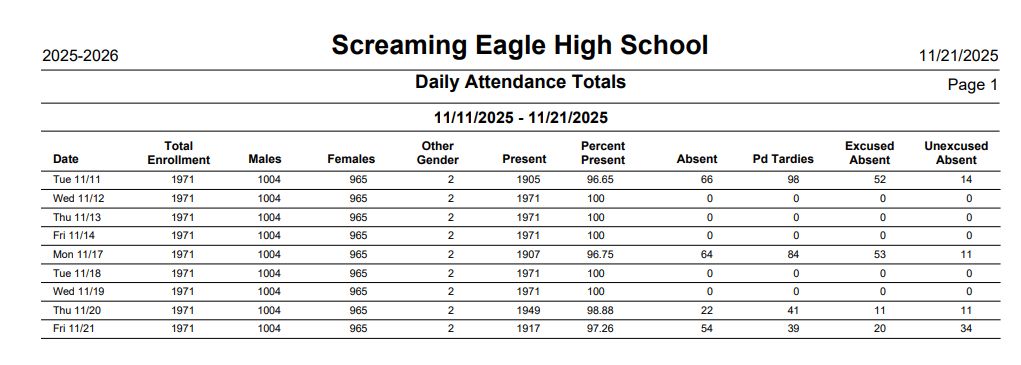
Print Chart in a Report ↑
A Print Chart button is available at the bottom of the page or in the upper right corner. Printing the chart will create a PDF report of the Attendance Dashboard data.


An example of the report is shown below.